Do you make graphs with your students? Of course you do, who doesn't? But do you know why it is important and what experiences your students should have to get the most out of graphing activities?
Why is graphing so important?
1. Graphs can engage students and create enthusiasm for math.
2. Graphs can be integrated into any subject, showing students the real world application and purpose for learning math concepts.
3. Graphs give students the opportunity to represent, compare and discuss mathematical relationships and concepts in new ways.
- Collecting information
- Tallying information
- Counting data points
- Surveying peers or others
- Sorting objects
- Making graphs with real objects
- Making picture graphs
- Reading graphs
- Making observations from a graph
- Comparing results with a friend
- Asking questions about a graph
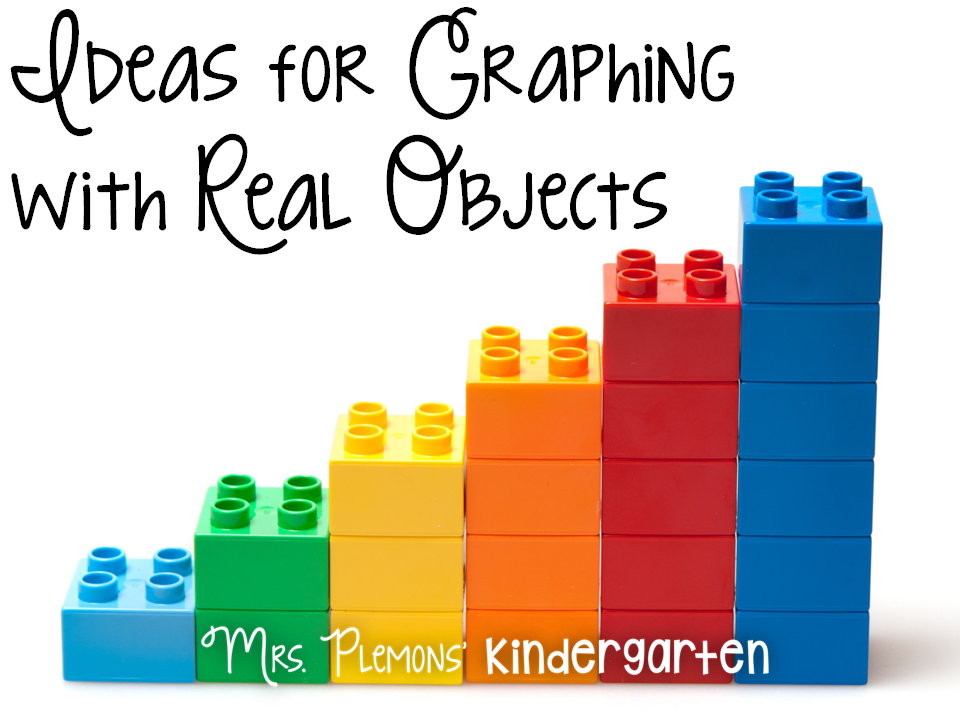
Using real objects is a great way to get started on graphing with young students. Gather any of those awesome math manipulatives or art supplies you have hanging around your classroom. They are great for graphing, by size, color, or type. Students can sort them and line them up on your table. You can then have students translate this information into a bar or picture graph. Learning to represent data in different ways is a key understanding for mathematical success.

Snacks are another one of my favorite items to graph with students. I used to love sorting my snacks into groups as a child and kindergarteners seem to do this naturally during snack time in my class anyways. So why not take advantage of this opportunity and have students create a graph and make observations about their data.
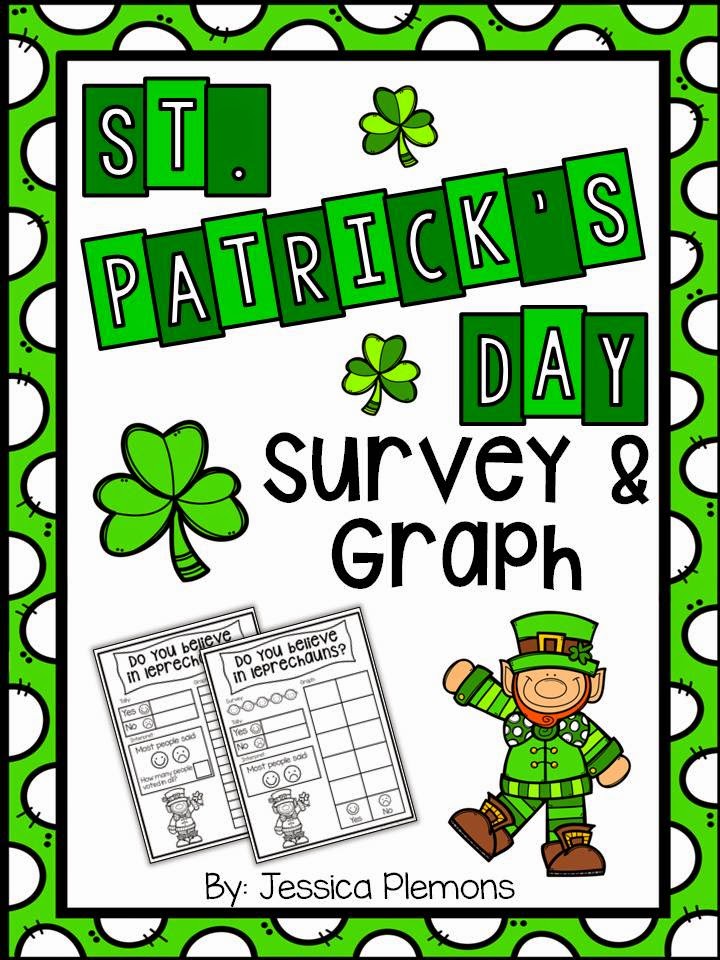
Teaching students to take surveys to collect data is another way to introduce a real world application of graphing. Maybe you are having a class ice cream party and need to know what flavor everyone would like. Or maybe a child wants to plan their birthday party at the local pool and wants to know if their friends can swim. Surveys are a quick efficient way to collect and organize the information you need.
So you've created a gorgeous graph, now what? Teaching students to analyze and interpret information from a graph is the ultimate goal. When we encounter graphs in real life we need to be able to gather information and understand what the graph is showing us. Using open ended questions are a great way to start to get students talking about a graph. I often ask my students to write what they notice about their graph. I tend to ask what has most and least first to get that out of the way, otherwise this can easily become the only information students feel is important to write about.
After students have the opportunity to tell what they notice you can ask follow up questions about things students may not have noticed.
- Which item has most/least?
- Which item has more/less than ___?
- Which items have the same?
- How many items were there in all?
- How many more ___ than ___?
When students create their own graphs based on different sets of data I also like to have them compare their graphs. For example when students graph a snack, they will likely end up with very different results, leading them to ask different types of questions.
- What did you have the most of? How is that different from your friend?
- Why do we have different data?
- Are there any patterns we see across multiple graphs?
Looking for some resources to help you get started on graphing in your classroom? Here are 3 FREEBIES for surveying, sorting and graphing.
And here are the links to my favorite graphing resources:


No comments:
Post a Comment